Waterpro 2026 Raffle

Win a FREE 1-Year Subscription to Sample Manager at WaterPro

120Water's water quality management solution that will keep your compliance programs on track.

Stop by 120Water's Booth #501 at WaterPro to see Sample Manager in action and enter for a chance to win!

Conditions apply.

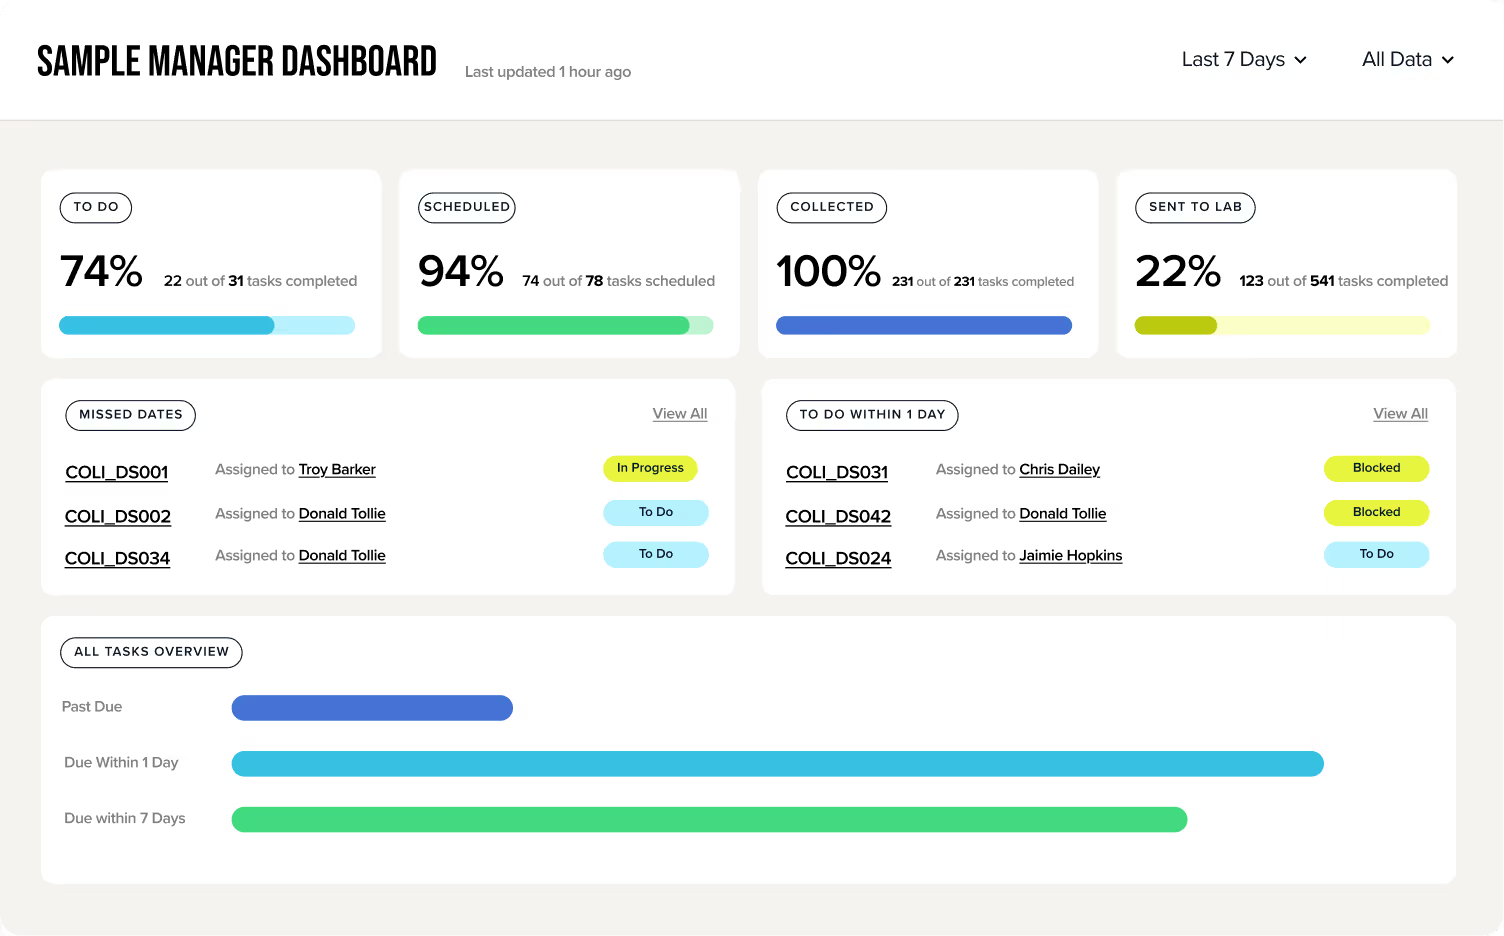
Sample Manager Dashboard showing task completion status: To Do 74%, Scheduled 94%, Collected 100%, Sent to Lab 22%, with detailed task lists by ID, assignees, status, and an overview bar chart for past due, due within 1 day, and due within 7 days.

Why Sample Manager

Save time

Centralize data

Reduce risks

Improve team coordination

75
%
Of U.S. drinking water violations are caused by missed or late samples due to changing requirements, scattered data, and manual tracking tools that can't keep up.
120Water's Sample Manager solves these challenges in one platform.

From collection to compliance – all in one place.
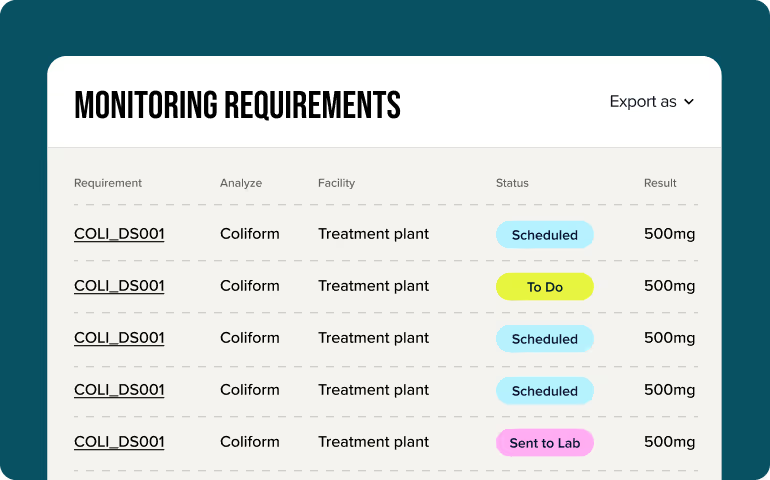
Table titled 'Monitoring Requirements' showing columns: Requirement, Analyze, Facility, Status, and Result with repeated entries of COLI_DS001, Coliform, Treatment plant, varied status labels Scheduled, To Do, Sent to Lab, and consistent result of 500mg.

Never miss a requirement

Stop manually tracking deadlines. Real-time updates keep your schedule accurate so you don’t find out about a missed sample after it’s already a problem.
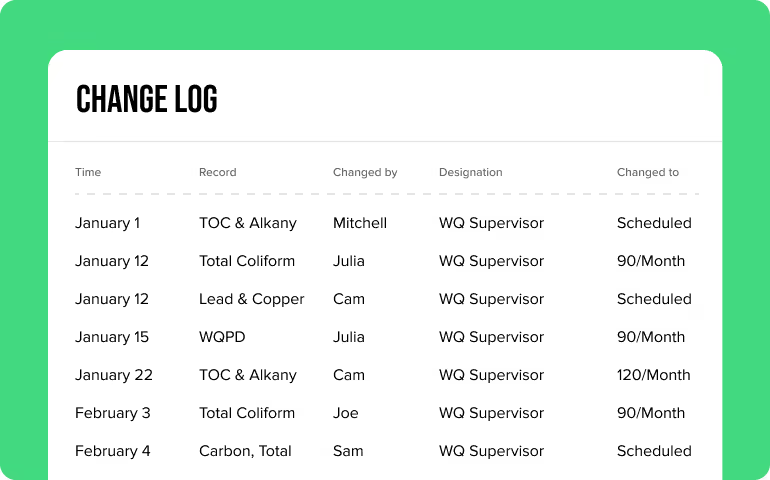
Change log table showing dates, records, changed by, designation as WQ Supervisor, and changes such as Scheduled or monthly values.

Get visibility into your process

When programs grow, confusion grows with them. Clear change logs document every step so you’re not chasing answers across emails and text threads.
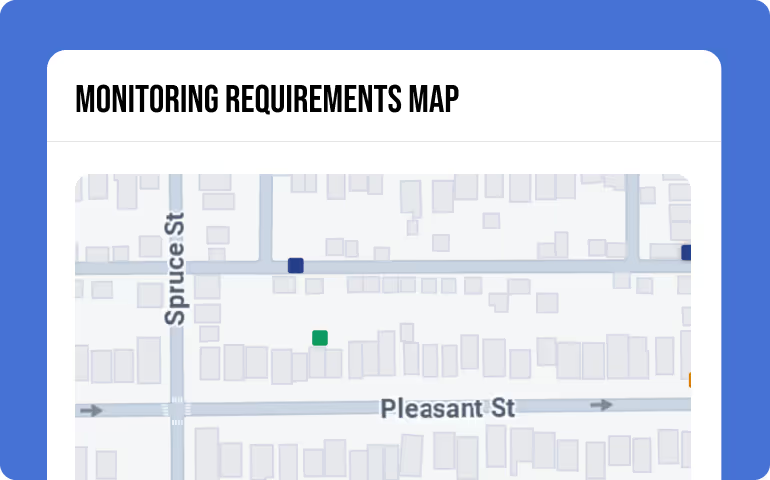
Map section highlighting monitoring requirement locations with colored square markers along Spruce St and Pleasant St.

Submit reports to your state

Formatting errors shouldn’t slow you down. Quickly transform and export your data into various formats, such as monthly operating reports, CCR's, and more.

Here’s how it works

Create and assign tasks in bulk to keep your team moving forward, and sync data with regulatory databases and connected labs.
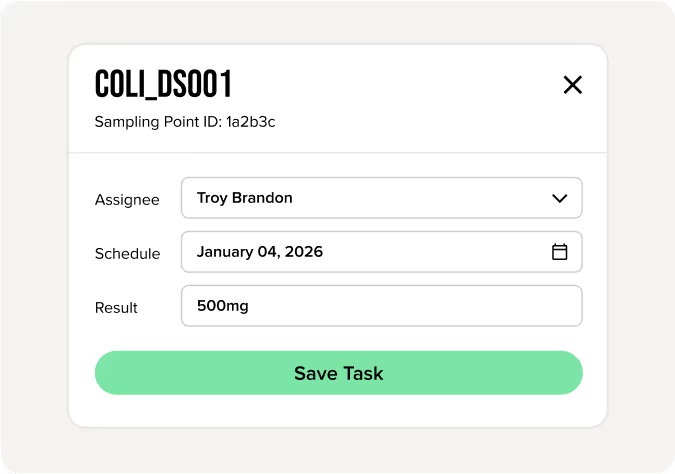
Task management modal titled COLI_DS001 with fields for assignee Troy Brandon, schedule January 04, 2026, result 500mg, and a green Save Task button.

Toggle between map, calendar, and timeline views for the big picture and every tiny detail.
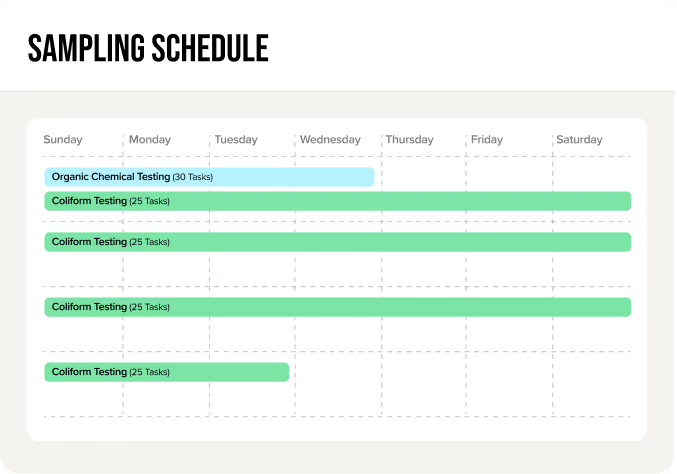
Sampling schedule chart showing Organic Chemical Testing with 30 tasks on Monday and Coliform Testing with 25 tasks from Monday to Saturday, and one shorter Coliform Testing bar ending Tuesday.

Get daily reminders and alerts about what’s on deck so nothing gets missed.
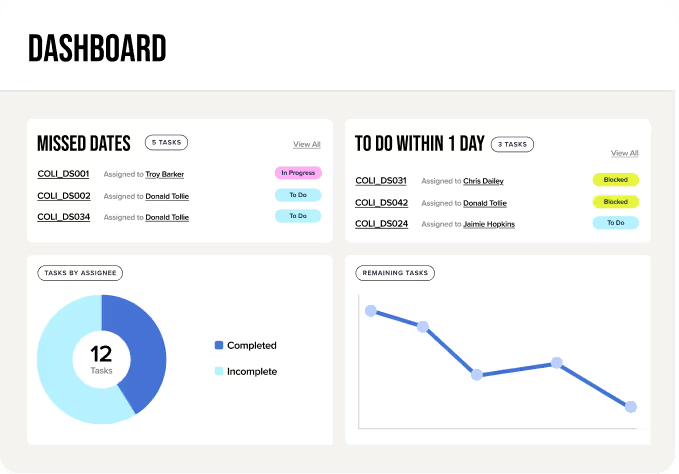
Dashboard showing missed and upcoming tasks with assigned users, task status labels, a pie chart of completed versus incomplete tasks, and a line graph of remaining tasks over time.

Upload results from all your labs into one system so the right data is there when you need it.
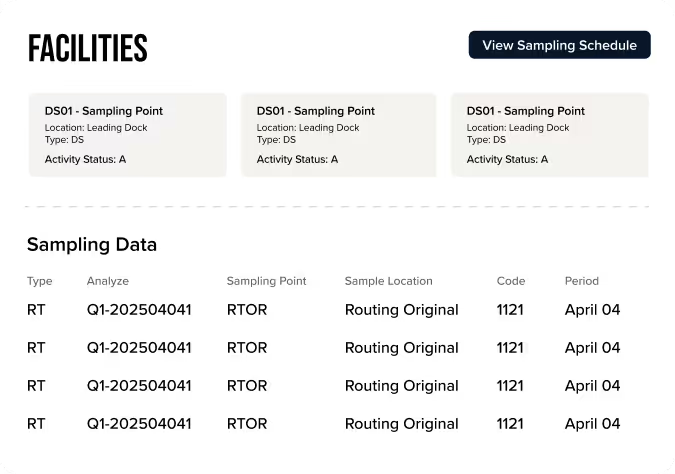
Table listing facilities with three 'DS01 - Sampling Point' entries all located at Leading Dock, type DS, status A, and sampling data showing repeated RT type with code 1121 and period April 04.

Generate and export clear, easy-to-use reports to stay compliant with the state.
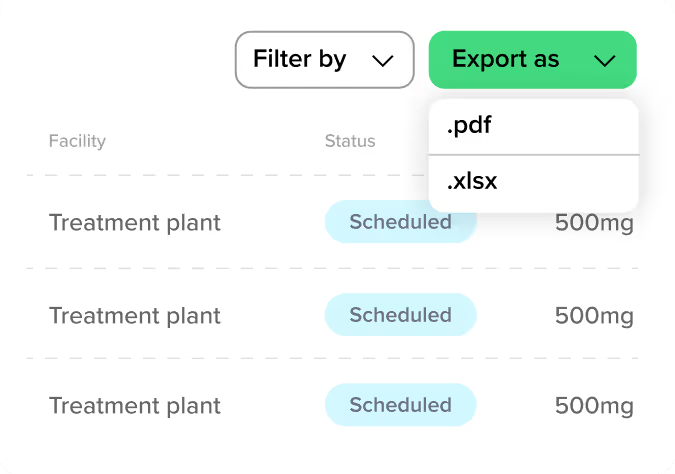
Table listing treatment plants with status marked as Scheduled and dosage of 500mg, featuring filter and export dropdowns offering PDF and XLSX formats.

Create a powerful hub to monitor long-term requirements, daily tasks, and big-picture results.
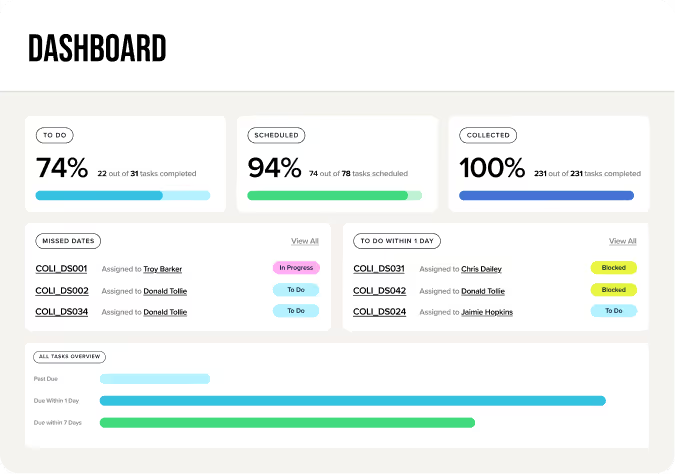
Dashboard showing task completion progress: 74% to do, 94% scheduled, and 100% collected with task details and status indicators like In Progress, To Do, and Blocked.