
Multi-System Management
see the full picture. finally.
Between scattered spreadsheets, paper records, and disconnected tools, it’s nearly impossible to get the big picture of your portfolio, let alone make confident decisions. 120Water's ClearView changes that by bringing all your utilities into one clean, easy-to-use dashboard.
Lorem ipsum dolor sit amet, consectetur adipiscing elit. Suspendisse varius enim in ersssssssss
For Multi-System Teams

Investor-owned utilities
Consulting firms
Public multi-systems
Associations
You've got the data. Let's make it work for you.
ClearView makes your data actionable across your entire portfolio of water systems. It keeps it centralized, organized, and analyzed so that resources can be sent to the right place.
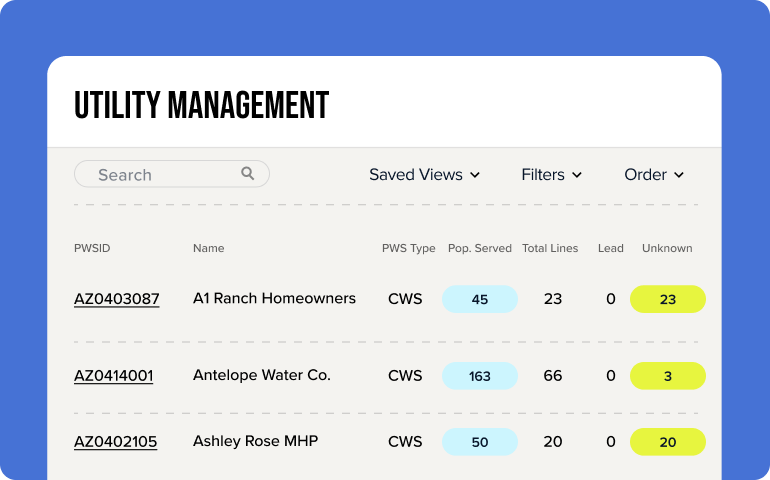
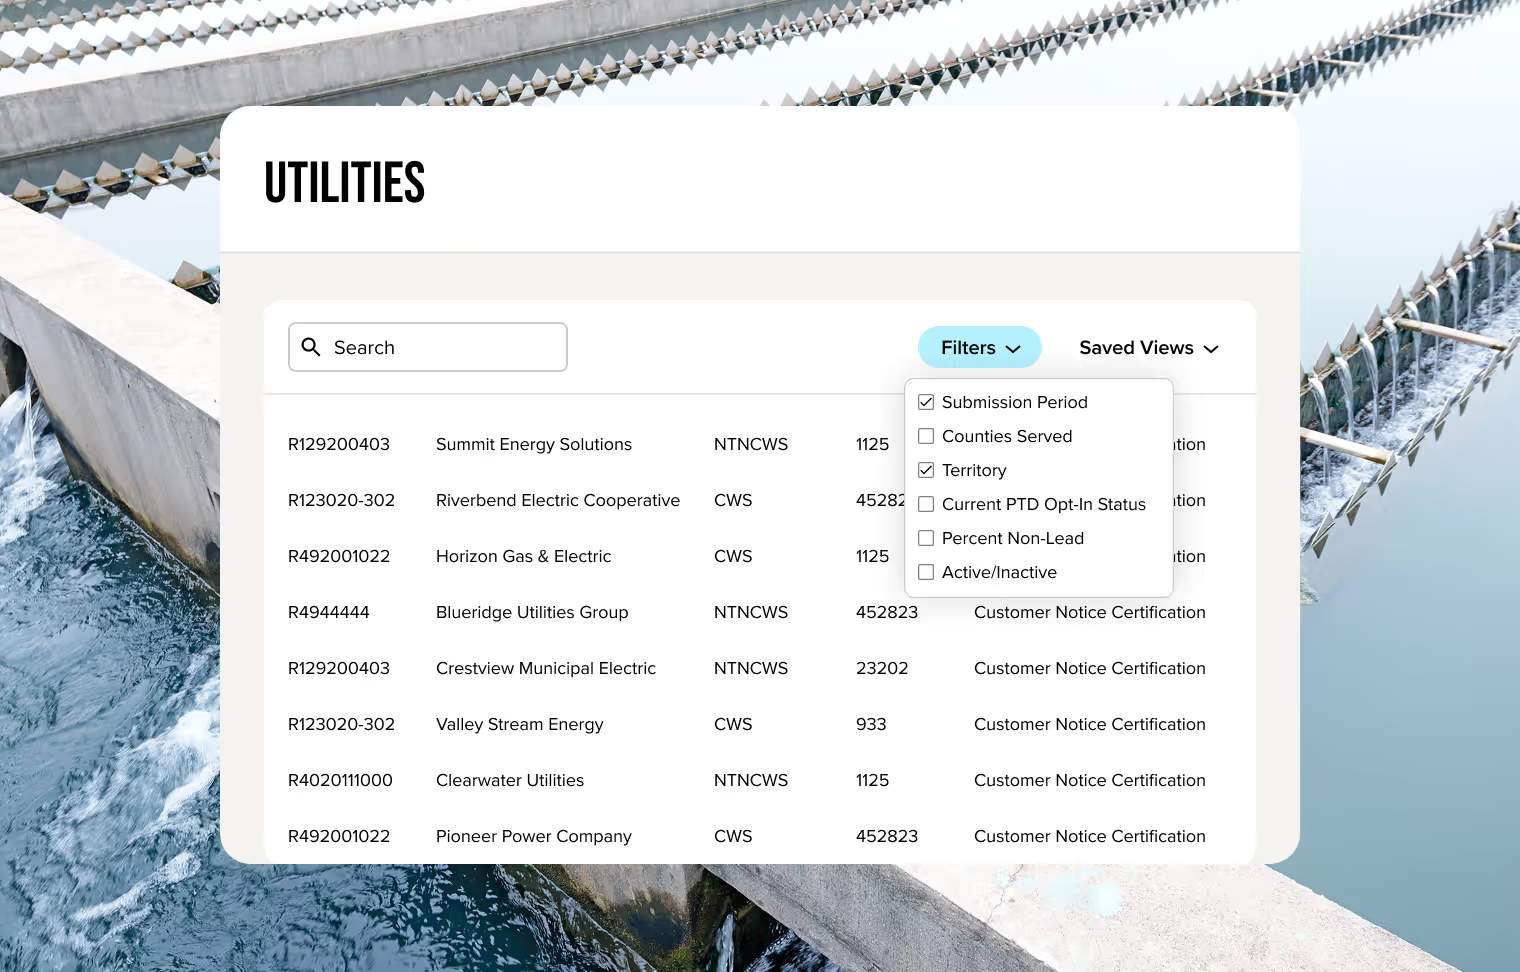
Everything in one spot
See a full list of every utility you manage and track progress on inventory, verification, and replacement in real time.

Spot red flags and take action
Quickly identify utilities that need extra support and direct resources where they’re needed most.
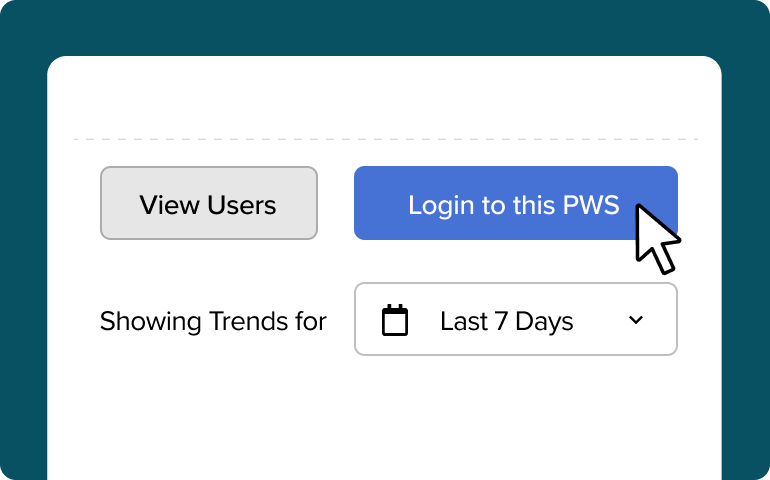
Go from high-level to hands-on
Jump from the high-level view into detailed information about individual water systems with just a click.
Here’s how it works
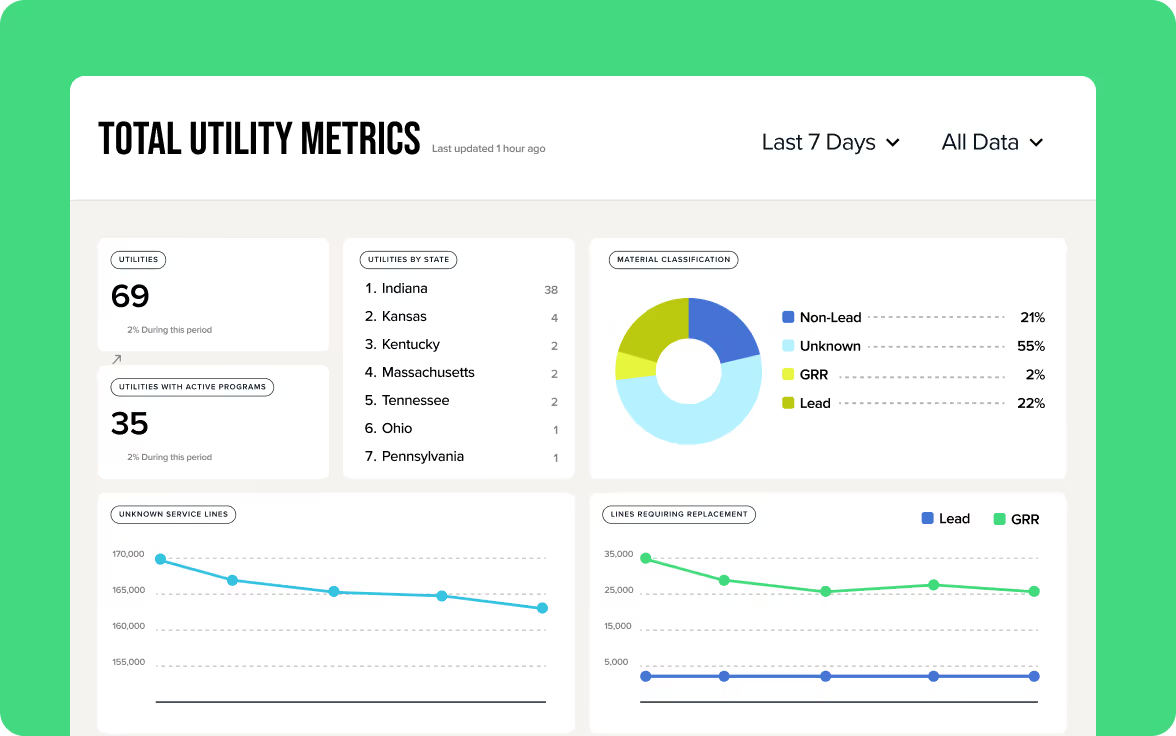
Key Metrics & Reporting
See important statistics and export data for internal reviews or external compliance submissions.
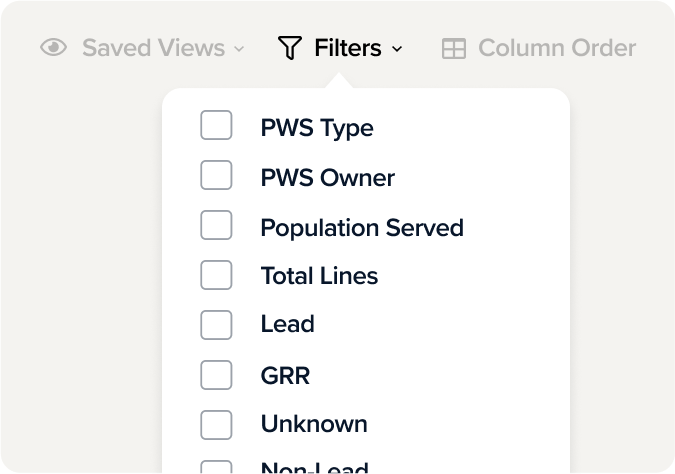
Advanced Filtering
Quickly isolate systems by program, geography, timeframe, progress, and more.
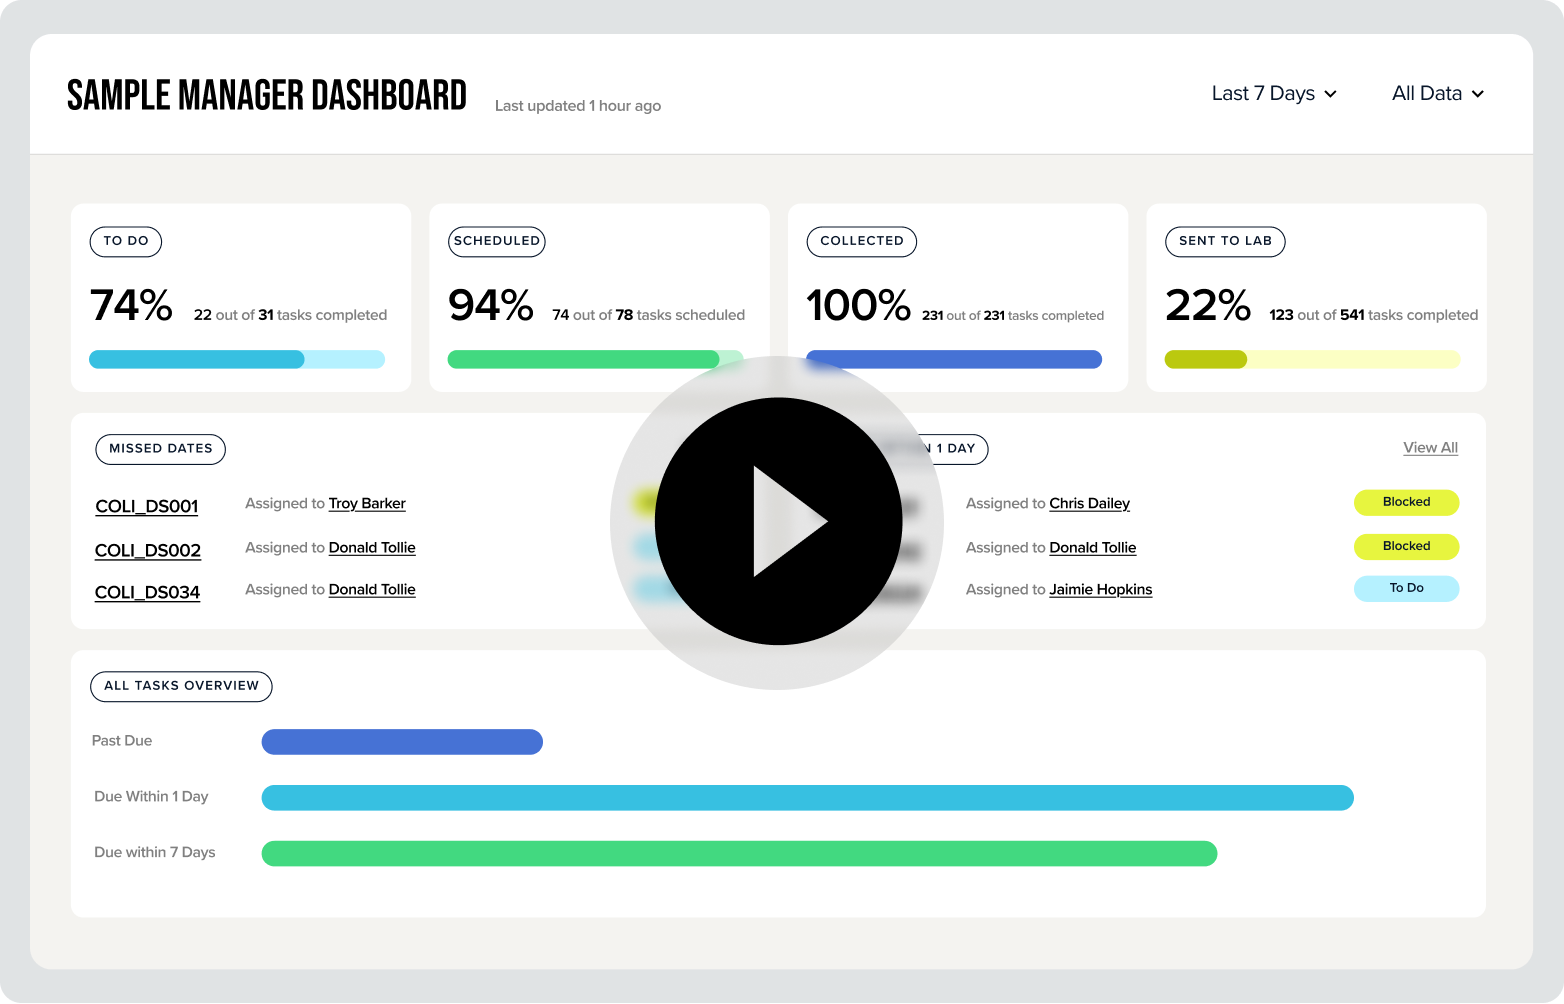
Automated Progress Tracking
Monitor inventory completion, verification, and replacement by utility in real time.
Integrated Access
Dive into detailed records and analytics for each system via 120Water’s PWS Platform.

Multi-System Management
“Keeping track of evolving regulations like the Lead and Copper Rule Improvements (LCRI) is a complex task for water utilities. Digital technologies and platforms can help utilities identify compliance gaps, prioritize projects, and manage resources.
At the end of the day, utilities are focused on providing safe drinking water to the communities they serve, and innovative solutions, such as those offered by 120Water, can help them deliver on that promise faster, smarter, and more efficiently.”
Ethan Edwards, Senior Analyst at Bluefield Research
Frequently Asked Questions
ClearView centralizes key metrics like inventory progress, replacement planning, and regulatory deadlines in one place. Instead of chasing updates from dozens or hundreds of systems, you can quickly see who is on track, who needs support, and where risks are emerging. It makes oversight easier, faster, and much more transparent.
The dashboard aggregates program-critical data, such as service line inventory completeness, unknown counts, LSL/GRR distribution, and verification progress. It surfaces trends and outliers across all participating systems, so you can make decisions with confidence.
Absolutely. ClearView highlights systems that are lagging behind requirements or showing increased risk. You can quickly pinpoint where field support, technical assistance, or targeted funding will make the biggest impact. Many customers use it to prioritize help for rural or under-resourced systems.
All information flows directly from the 120Water PWS platform. As systems update inventories, the data automatically syncs to the ClearView dashboard. This eliminates back-and-forth emails and ensures state or regional leaders always see the most current information.
By giving everyone a shared source of truth, ClearView reduces confusion and creates alignment. States and regional leaders can communicate expectations clearly, water systems can monitor their own progress, and everyone benefits from consistent data and reporting.