
Sample Manager
Stay on schedule. Stay compliant.
Simplify water quality compliance with one powerful, easy-to-use tool.
Lorem ipsum dolor sit amet, consectetur adipiscing elit. Suspendisse varius enim in ersssssssss
Why Sample Manager

Save time
Centralize data
Reduce risks
Improve team coordination
From collection to compliance – all in one place.
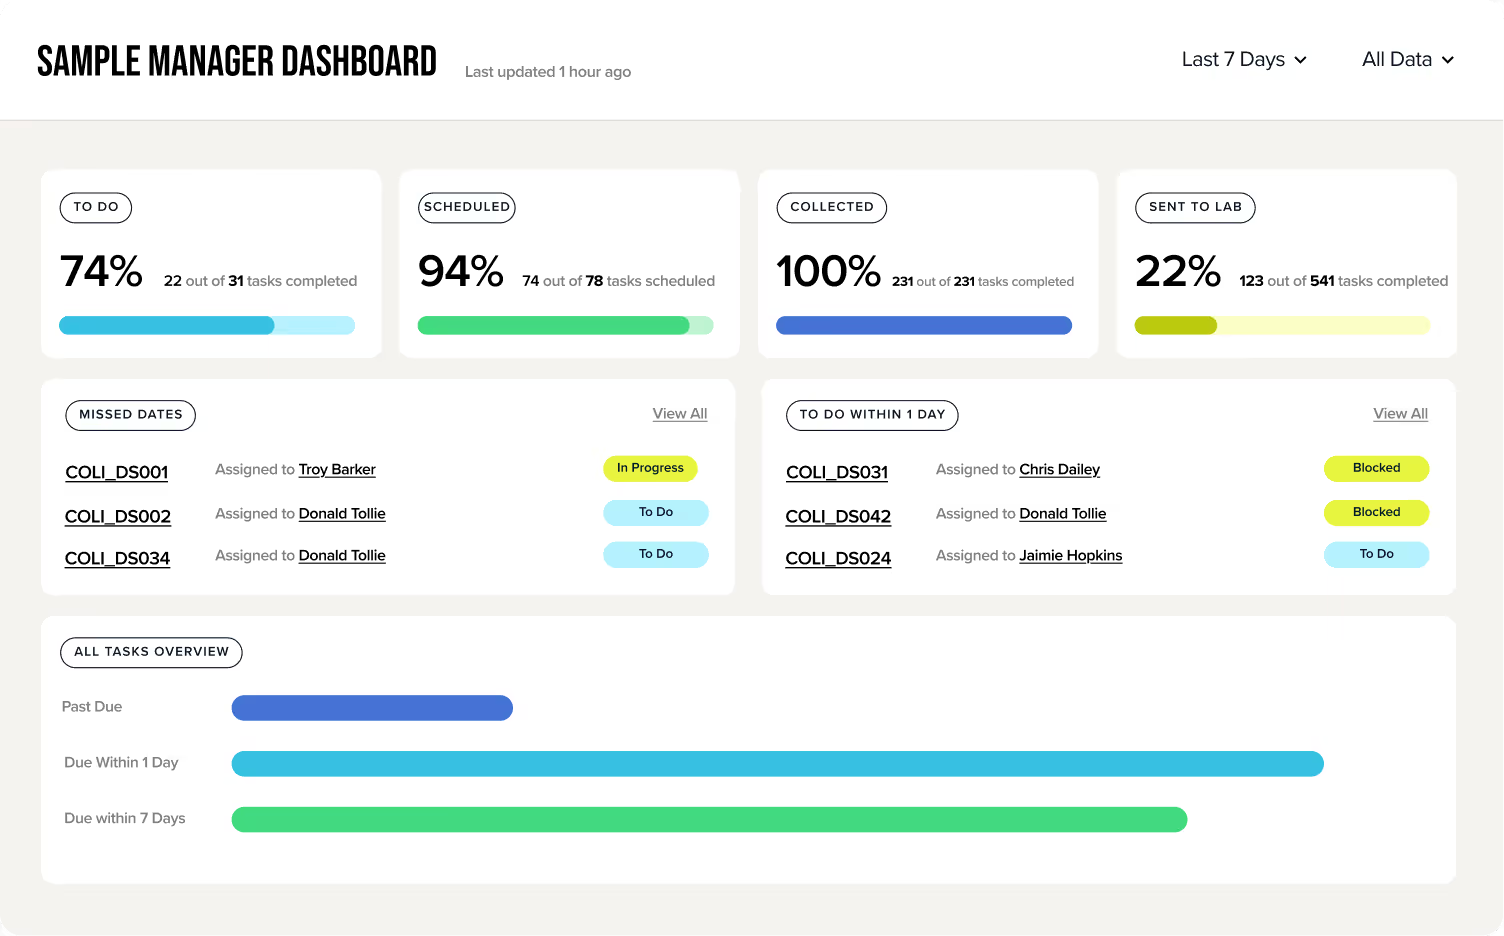
Never miss a requirement
Stop manually tracking deadlines. Real-time updates keep your schedule accurate so you don’t find out about a missed sample after it’s already a problem.
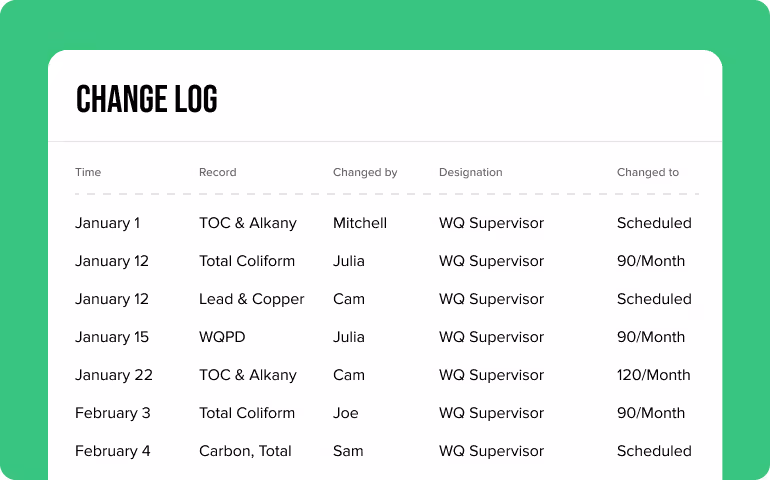
Get visibility into your process
When programs grow, confusion grows with them. Clear change logs document every step so you’re not chasing answers across emails and text threads.
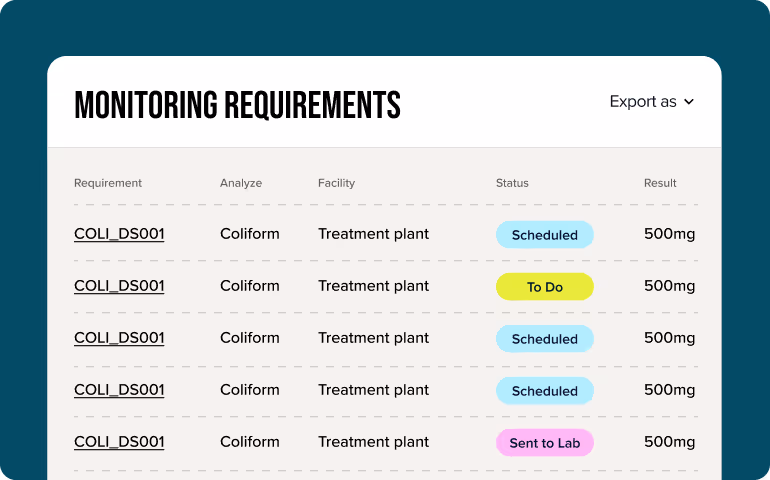
Submit reports to your state
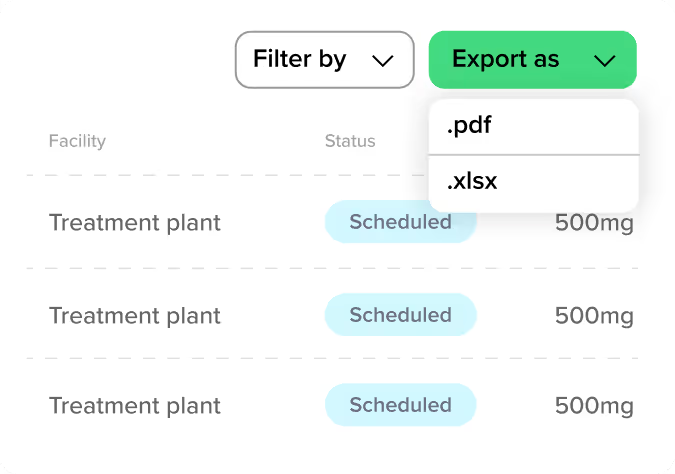
Formatting errors shouldn’t slow you down. Quickly transform and export your data into various formats, such as monthly operating reports, CCR's, and more.
Here’s how it works
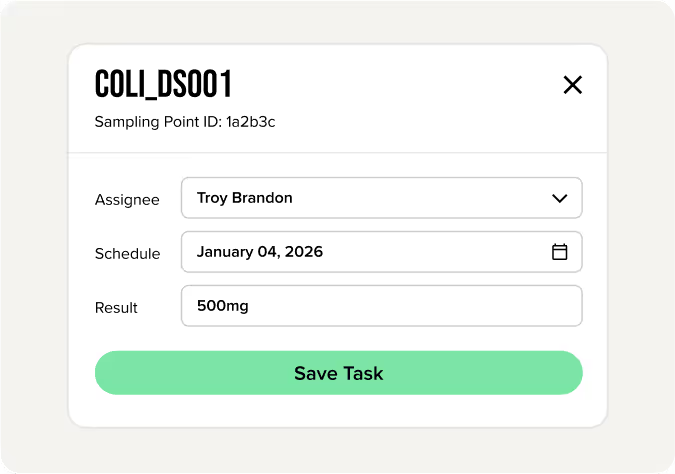
Create and assign tasks in bulk to keep your team moving forward, and sync data with regulatory databases and connected labs.
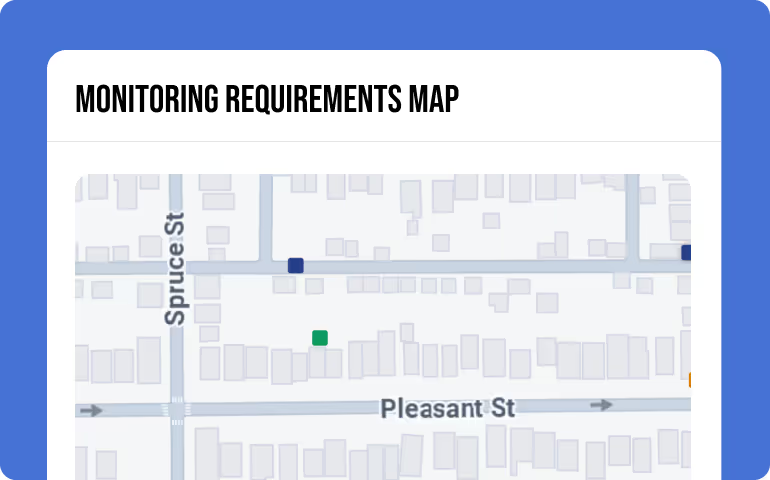
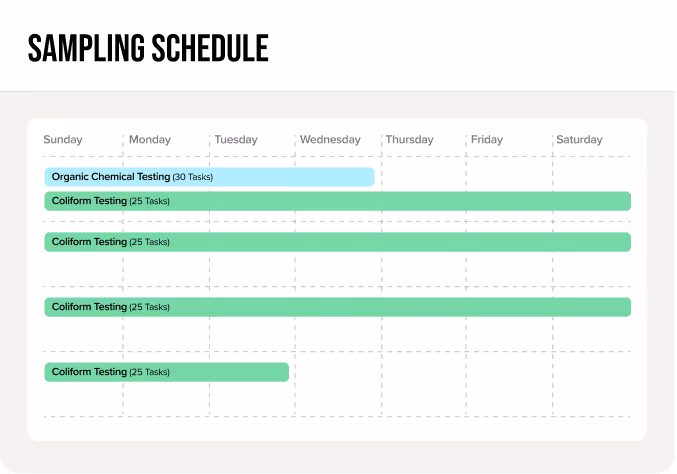
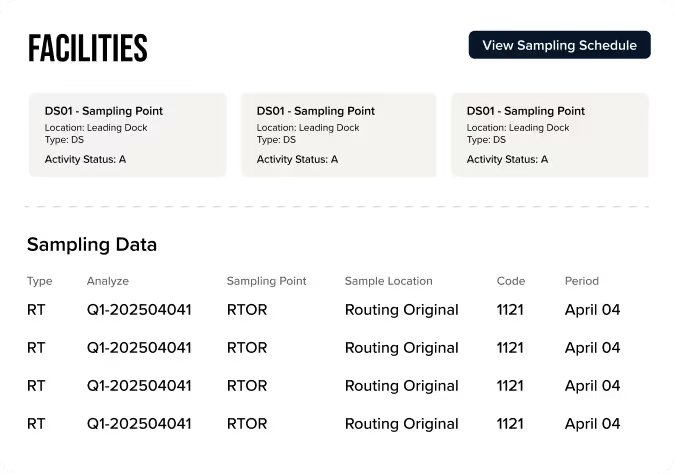
Toggle between map, calendar, and timeline views for the big picture and every tiny detail.
Get daily reminders and alerts about what’s on deck so nothing gets missed.
Upload results from all your labs into one system so the right data is there when you need it.
Generate and export clear, easy-to-use reports to stay compliant with the state.
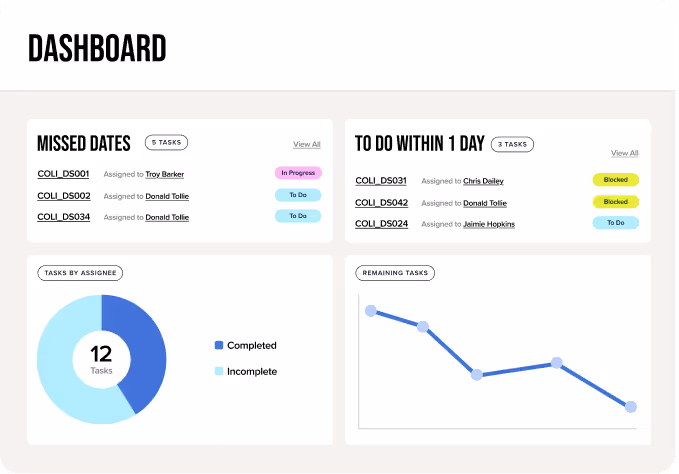
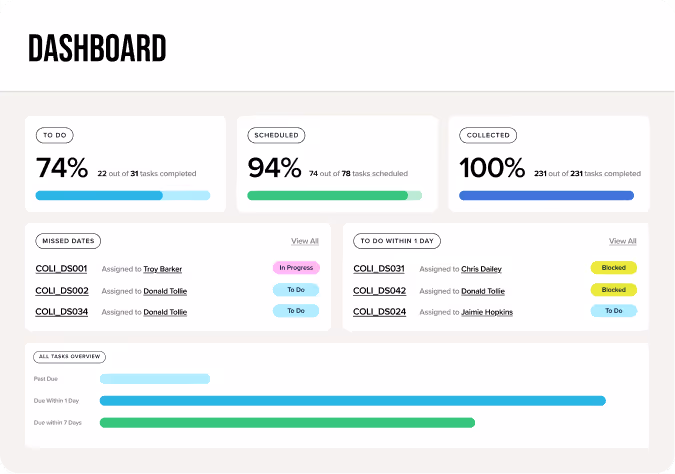
Create a powerful hub to monitor long-term requirements, daily tasks, and big-picture results.
Frequently Asked Questions
Sample Manager makes it far more efficient and connected for teams to centralize monitoring schedules, workflows, reminders, results, and reporting. With Sample Manager, teams see a reduction in missed samples and violations caused by manual processes.
Yes, Sample Manager is designed to support any monitoring program in one easy-to-use platform.
Yes. Lab results can flow directly into the platform and data can be submitted from state reporting systems without manual entry.
Automated schedules, task assignments, and deadline alerts make sure nothing slips through the cracks and empower your team to stay on top of every task, no matter how small.